featureGroupSpectra allows to extract a Spectrum object for each feature
group in x. Based on the specified function FUN different types of
spectra can be returned:
featureGroupPseudoSpectrumcreates a pseudo spectrum based on the feature values (defined byvalue) of all features within a feature group (i.e. each feature is represented as a mass peak in the resulting spectrum). The reported m/z values will be the"mzmed"of the respective feature from thefeatureDefinitions()data frame. The associated intensity is calculated from the values of the features from the feature group: by default, for each feature, the median intensity across all samples part ofsubsetis reported. Parametersvalueandfilledare passed to the internal call tofeatureValues()that returns the features' values which are used in these calculations. Parameternallows to further restrict the samples being considered in the calculations: for each feature group samples are first ordered by the sum of signal of the features of the group and then only the top n samples are used in the calculations.Examples: To report the mean intensity of each feature in the 10 samples with the highest signal for the feature group use
n = 10andintensityFun = mean. The m/z values reported in theSpectrumobject of a feature group will be the"mzmed"of the features, the intensity values the mean intensity (value = "maxo") across the 10 samples with the highest signal for that feature group.To report the maximal intensity (
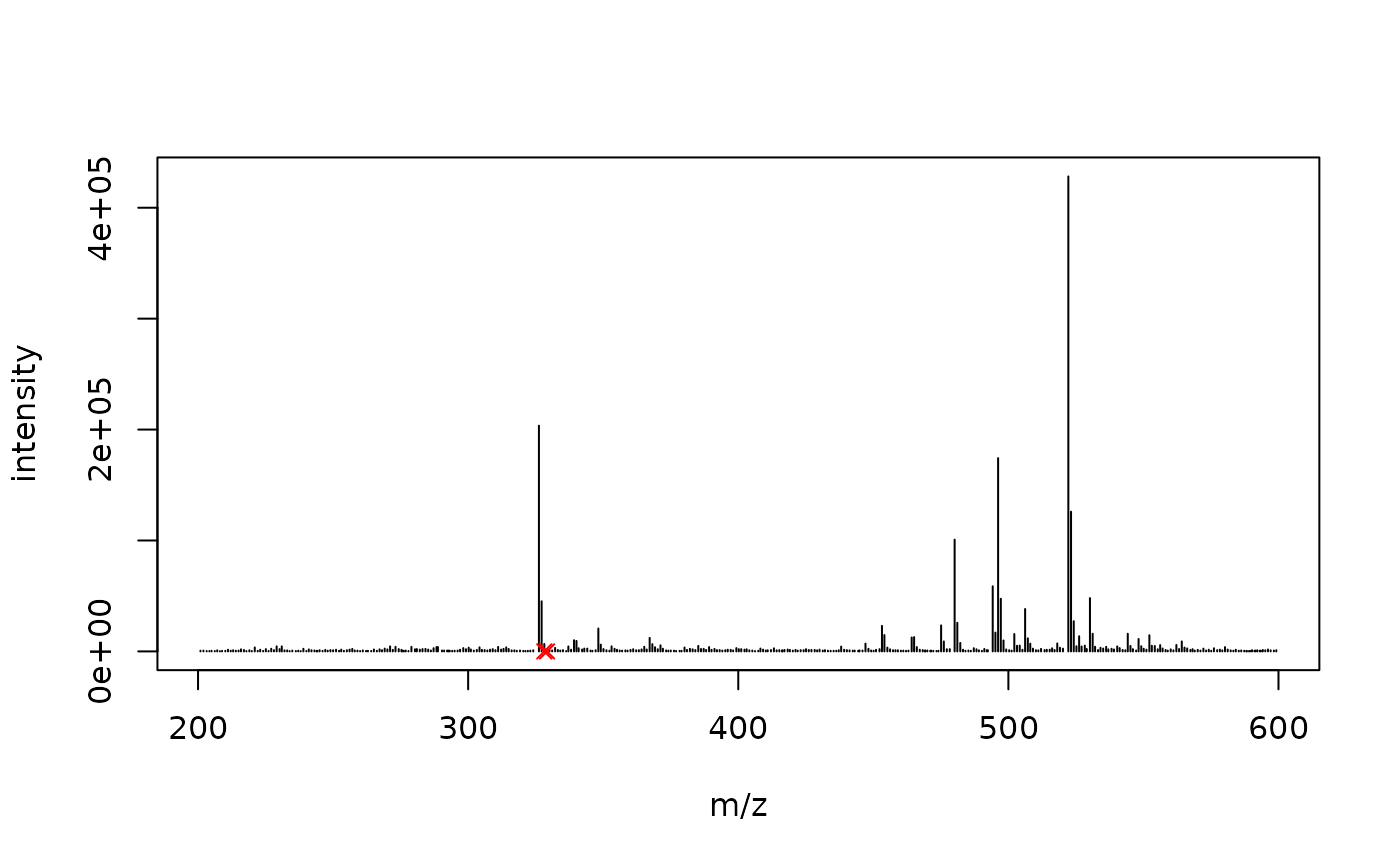
value = "maxo"of each feature in samples 1, 4, 8 and 10 usesubset = c(1, 4, 8, 10)andintensityFun = max. More examples in the examples section.featureGroupFullScan: reports the full MS1 spectrum (full scan) in the sample with the highest total signal (defined byvalue) for the feature group at the retention time closest to the median"rtmed"across all features of the feature group.
featureGroupSpectra(
  x,
  featureGroup = featureGroups(x),
  FUN = featureGroupPseudoSpectrum,
  value = "maxo",
  filled = TRUE,
  subset = seq_along(fileNames(x)),
  ...
)

featureGroupPseudoSpectrum(
  featureGroup = character(),
  x,
  fvals = featureValues(x),
  n = ncol(fvals),
  intensityFun = median,
  ...
)

featureGroupFullScan(
  featureGroup = character(),
  x,
  fvals = featureValues(x),
  ...
)
Arguments
| x |
|
|---|---|
| featureGroup |
|
| FUN |
|
| value |
|
| filled | for |
| subset |
|
| ... | additional parameters passed down to the function specifyed with
|
| fvals | for |
| n | for |
| intensityFun | for |
Value
for featureGroupSpectra: MSpectra object of length equal to the
number of feature groups in x and each element being one spectrum.
For all other functions: a Spectrum object.
Author
Johannes Rainer
Examples
## Load test data set from xcms library(xcms) data(faahko_sub) ## Update the path to the files for the local system dirname(faahko_sub) <- system.file("cdf/KO/", package = "faahKO") ## Perform correspondence analysis xdata <- groupChromPeaks(faahko_sub, param = PeakDensityParam(sampleGroup = rep(1, 3)))#>#>## Group features xdata <- groupFeatures(xdata, param = SimilarRtimeParam(4)) xdata <- groupFeatures(xdata, param = AbundanceSimilarityParam(threshold = 0.3)) sort(table(featureGroups(xdata)))#> #> FG.004.002 FG.005.002 FG.006.001 FG.006.002 FG.011.001 FG.012.001 FG.013.001 #> 1 1 1 1 1 1 1 #> FG.014.001 FG.015.001 FG.016.001 FG.017.001 FG.018.001 FG.019.001 FG.020.001 #> 1 1 1 1 1 1 1 #> FG.021.001 FG.022.001 FG.023.001 FG.024.001 FG.025.001 FG.026.001 FG.027.001 #> 1 1 1 1 1 1 1 #> FG.028.001 FG.029.001 FG.030.001 FG.031.001 FG.032.001 FG.033.001 FG.001.001 #> 1 1 1 1 1 1 2 #> FG.002.001 FG.005.001 FG.007.001 FG.008.001 FG.009.001 FG.010.001 FG.003.001 #> 2 2 2 2 2 2 3 #> FG.004.001 #> 3################ ## featureGroupSpectra ## ## Get a pseudo spectrum for each feature group res <- featureGroupSpectra(xdata) res#> MSpectra with 36 spectra and 2 metadata column(s): #> msLevel rtime peaksCount | feature_group feature_id #> <integer> <numeric> <integer> | <character> <CharacterList> #> 1 1 2787.77 3 | FG.004.001 FT01,FT04,FT46 #> 2 1 3254.90 1 | FG.011.001 FT02 #> 3 1 3387.14 3 | FG.003.001 FT03,FT37,FT38 #> 4 1 2994.34 1 | FG.012.001 FT05 #> 5 1 2923.92 1 | FG.013.001 FT06 #> .. ... ... ... . ... ... #> 32 1 3482.61 1 | FG.029.001 FT42 #> 33 1 3580.41 1 | FG.030.001 FT43 #> 34 1 3712.65 1 | FG.031.001 FT44 #> 35 1 2918.44 1 | FG.032.001 FT45 #> 36 1 3707.18 1 | FG.033.001 FT47## Get a full scan spectrum for a subset of the feature groups ## considering only the subset of the last two samples res <- featureGroupSpectra(xdata, featureGroup = unique(featureGroups(xdata))[1:4], FUN = featureGroupFullScan, subset = 2:3) res#> MSpectra with 4 spectra and 2 metadata column(s): #> msLevel rtime peaksCount | feature_group feature_id #> <integer> <numeric> <integer> | <character> <CharacterList> #> 1 1 2787.77 421 | FG.004.001 FT01,FT04,FT46 #> 2 1 3254.12 410 | FG.011.001 FT02 #> 3 1 3387.14 404 | FG.003.001 FT03,FT37,FT38 #> 4 1 2994.34 410 | FG.012.001 FT05################ ## Pseudo Spectrum ## ## Get the pseudo spectrum for one feature group reporting the per-feature ## maximal "maxo" value across samples as the spectrum's intensities res <- featureGroupPseudoSpectrum(featureGroup = "FG.010.001", xdata, fvals = featureValues(xdata, value = "maxo"), intensityFun = max) intensity(res)#> FT10 FT11 #> 232896 50504mz(res)#> [1] 326.2 327.2## Get the pseudo spectrum using the values in the one sample with the ## highest total sum of signal ("maxo") for the feature group. res <- featureGroupPseudoSpectrum(featureGroup = "FG.010.001", xdata, fvals = featureValues(xdata, value = "maxo"), n = 1) intensity(res)#> FT10 FT11 #> 232896 50504mz(res)#> [1] 326.2 327.2################ ## Full Scan Spectrum ## ## Get the full MS1 spectrum from the sample with the highest total signal ## of one specific feature group res <- featureGroupFullScan(featureGroup = "FG.010.001", xdata, fvals = featureValues(xdata, value = "maxo")) plot(mz(res), intensity(res), type = "h", xlab = "m/z", ylab = "intensity")## Highlight the peaks for the features of the group. idx <- which(featureGroups(xdata) == "FG.001.001") points(x = featureDefinitions(xdata)$mzmed[idx], y = rep(0, length(idx)), pch = 4, col = "red")
